
Часто вам может понадобиться создать два графика рядом, используя пакет ggplot2 в R. К счастью, это легко сделать с помощью пакета patchwork .
#install ggplot2 and patchwork packages
install.packages('ggplot2')
install.packages('patchwork')

#load the packages
library(ggplot2)
library(patchwork)
В этом руководстве показано несколько примеров использования этих пакетов для создания параллельных графиков.
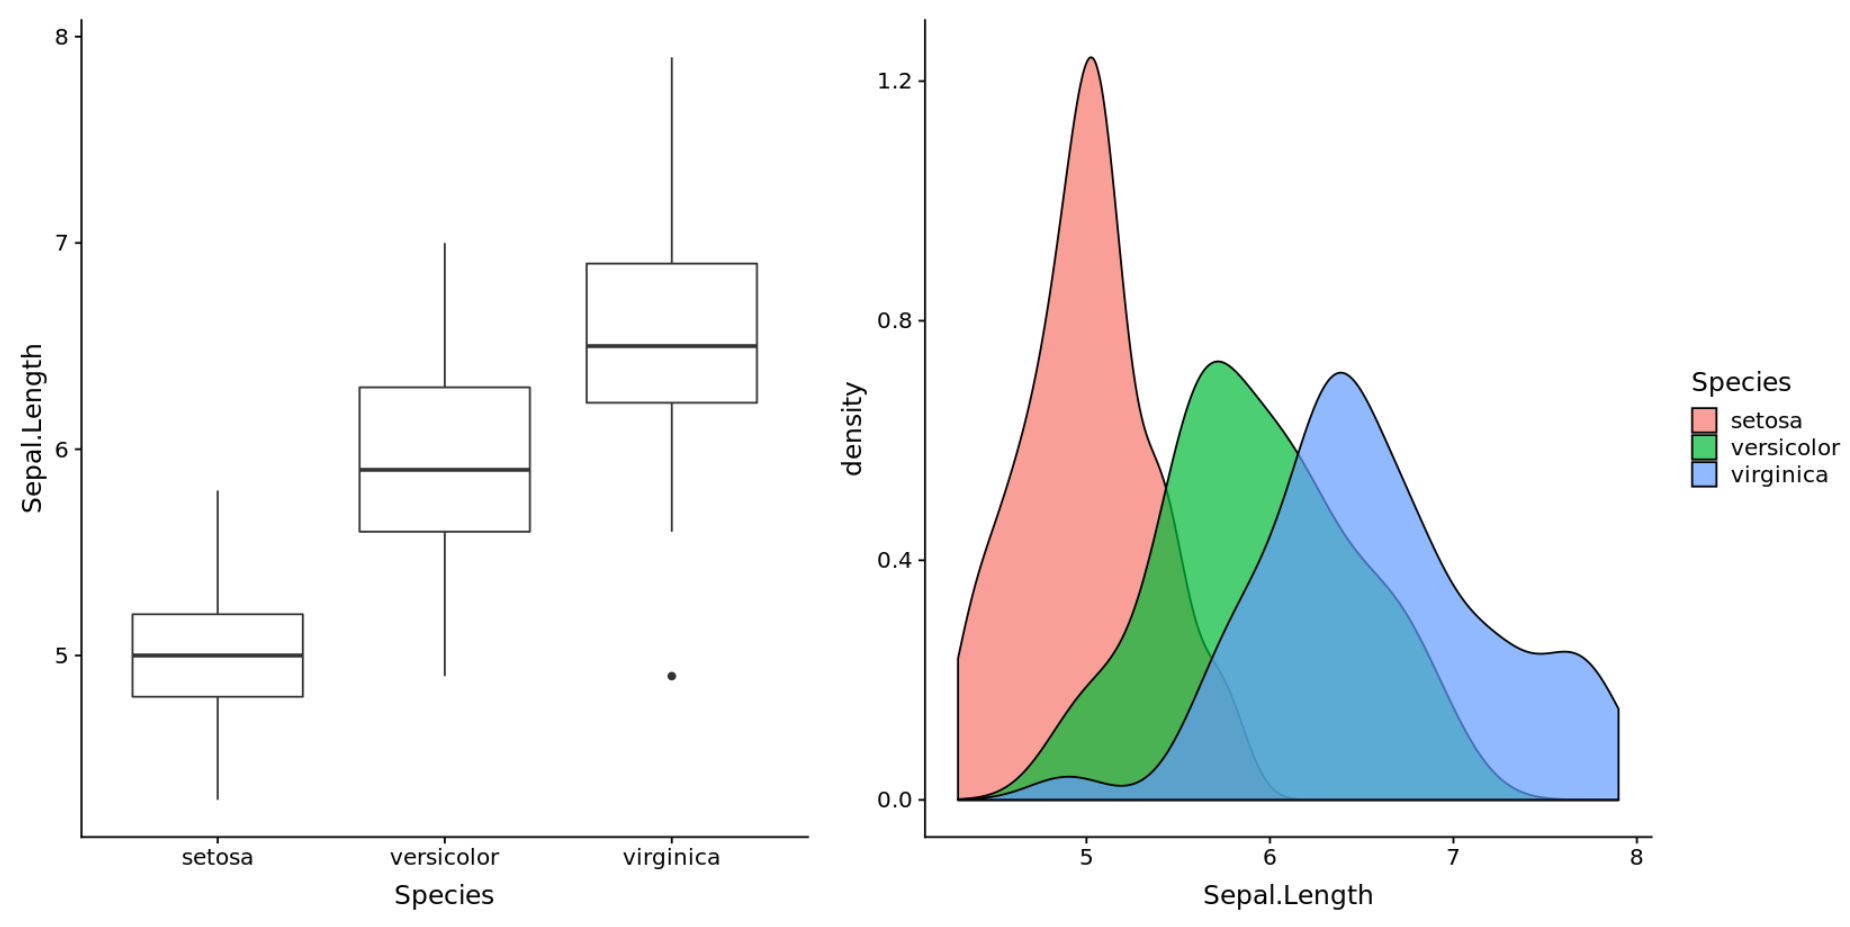
Пример 1: два графика рядом
В следующем коде показано, как создать два параллельных графика, используя встроенный в R набор данных радужной оболочки :
#create box plot
plot1 <- ggplot(iris, aes(x = Species, y = Sepal.Length)) +
 geom_boxplot()

#create density plot
plot2 <- ggplot(iris, aes(x = Sepal.Length, fill = Species)) +
 geom_density(alpha = 0.8)

#display plots side by side
plot1 + plot2
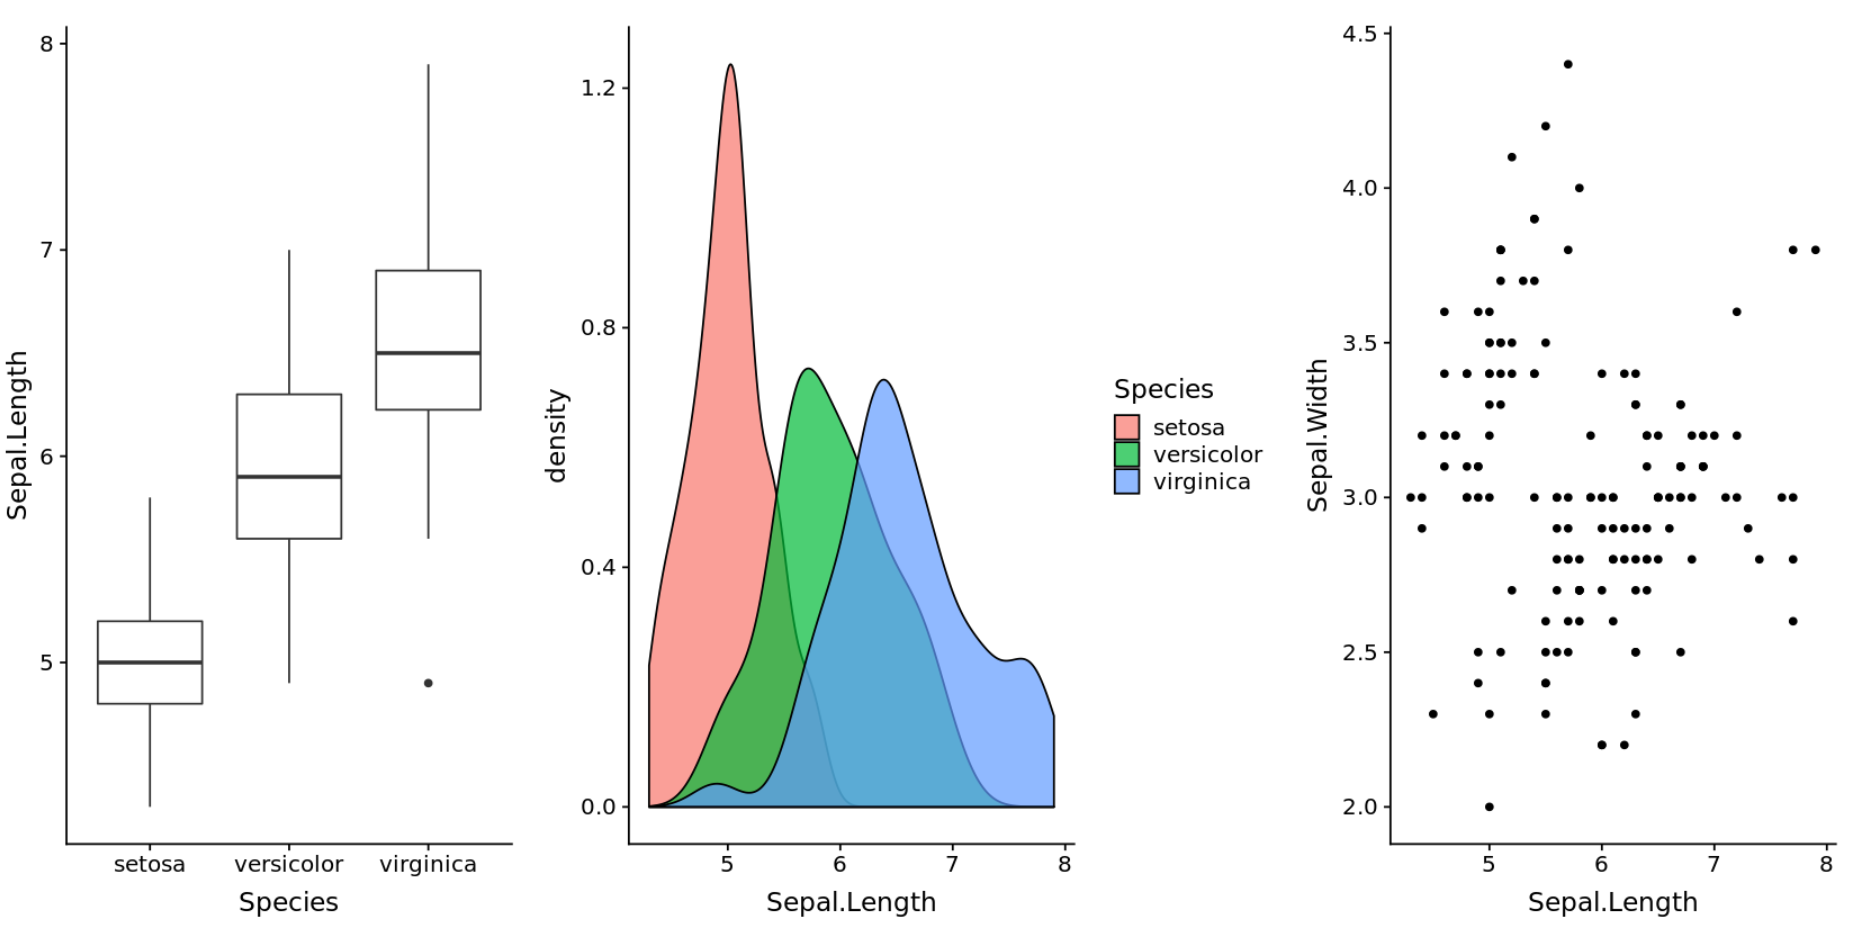
Пример 2: три параллельных графика
В следующем коде показано, как создать три параллельных графика с использованием встроенного в R набора данных радужной оболочки :
#create box plot
plot1 <- ggplot(iris, aes(x = Species, y = Sepal.Length)) +
 geom_boxplot()

#create density plot
plot2 <- ggplot(iris, aes(x = Sepal.Length, fill = Species)) +
 geom_density(alpha = 0.7)

#create scatterplot
plot3 <- ggplot(iris, aes(x = Sepal.Length, y = Sepal.Width)) +
 geom_point()

#display three plots side by side
plot1 + plot2 + plot3
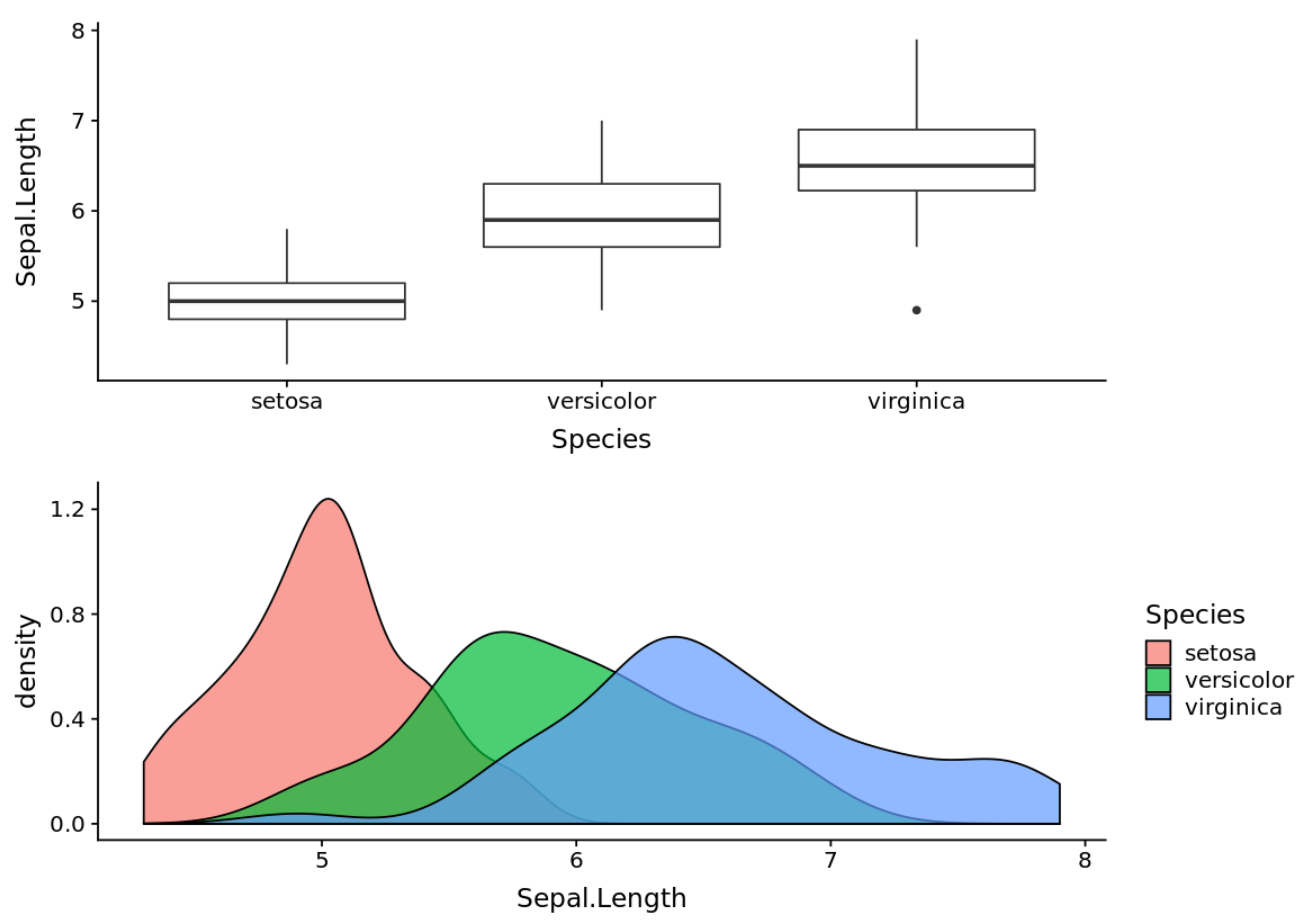
Пример 3: два сложенных графика
В следующем коде показано, как создать два сложенных графика, один поверх другого:
#create box plot
plot1 <- ggplot(iris, aes(x = Species, y = Sepal.Length)) +
 geom_boxplot()

#create density plot
plot2 <- ggplot(iris, aes(x = Sepal.Length, fill = Species)) +
 geom_density(alpha = 0.7)

#display plots stacked on top of each other
plot1 / plot2
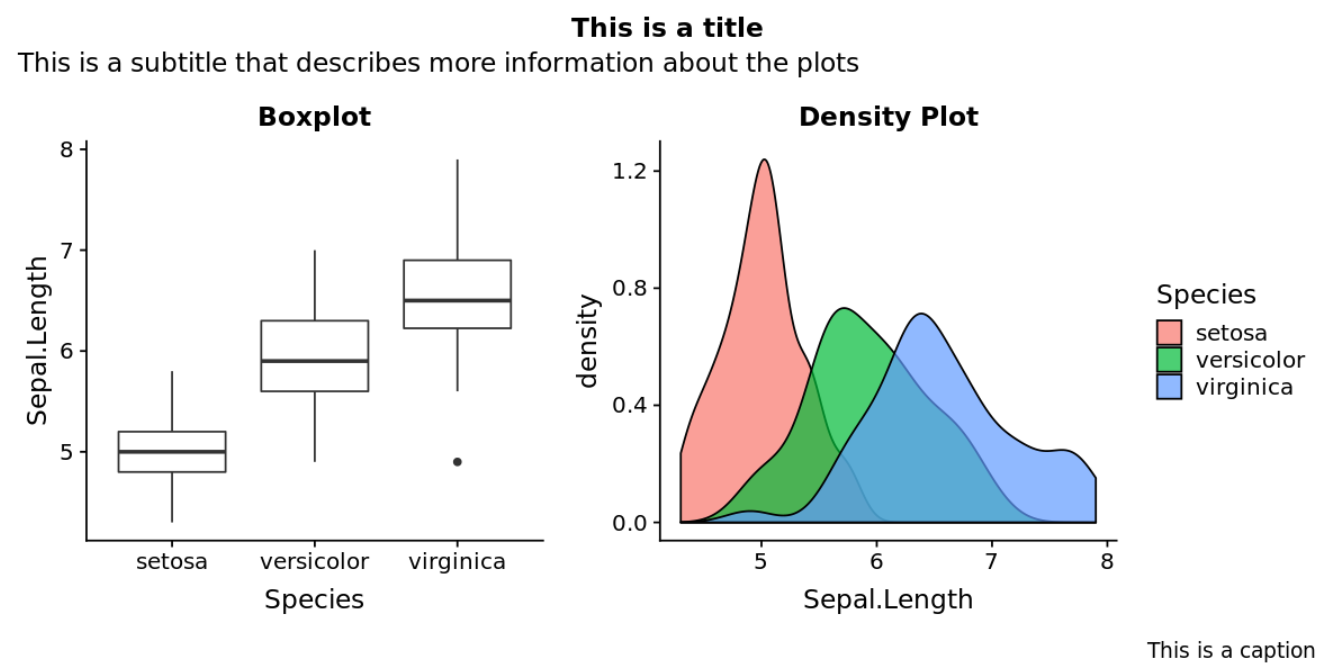
Пример 4. Добавьте заголовки, субтитры и подписи
В следующем коде показано, как добавить заголовки, субтитры и подписи к графикам:
#create box plot
plot1 <- ggplot(iris, aes(x = Species, y = Sepal.Length)) +
 geom_boxplot() +
 ggtitle('Boxplot')

#create density plot
plot2 <- ggplot(iris, aes(x = Sepal.Length, fill = Species)) +
 geom_density(alpha = 0.7) +
 ggtitle('Density Plot')

#display plots side by side with title, subtitle, and captions
patchwork <- plot1 + plot2

patchwork + plot_annotation(
 title = 'This is a title',
 subtitle = 'This is a subtitle that describes more information about the plots',
 caption = 'This is a caption '
)
Вы можете найти больше руководств по R здесь .